


The Race to Lord's: A Deep Dive into the WTC 2025-27 Points Table
The ICC World Test Championship (WTC) is in full swing, and the race for a spot in the 2027 final at Lord's is heating up. With a new cycle underway, teams are battling it out for every point, and the standings are constantly shifting. If you're a die-hard Test cricket fan, keeping track of the points table is essential to understanding the dynamics of the competition.
Understanding the WTC Points System: It's All About PCT
Unlike traditional league tables, the WTC doesn't simply rank teams by total points. The key metric is the Percentage of Points (PCT). This innovative system was introduced to level the playing field, as not all teams play the same number of matches. Here's a quick breakdown of how the points are awarded:
- Win: 12 points
- Tie: 6 points
- Draw: 4 points
- Loss: 0 points
The PCT is calculated by dividing the total points a team has earned by the total points they could have earned. This ensures that a team that has played fewer matches but has a high win percentage is ranked higher than a team with more points but a lower win percentage.
Another crucial factor is the slow over-rate penalty. For every over a team is short, they lose one point from their total. This can be a game-changer, as we've seen in the past, where crucial points were deducted, impacting a team's final standing.
WTC 2025-27 Points Table: Current Standings
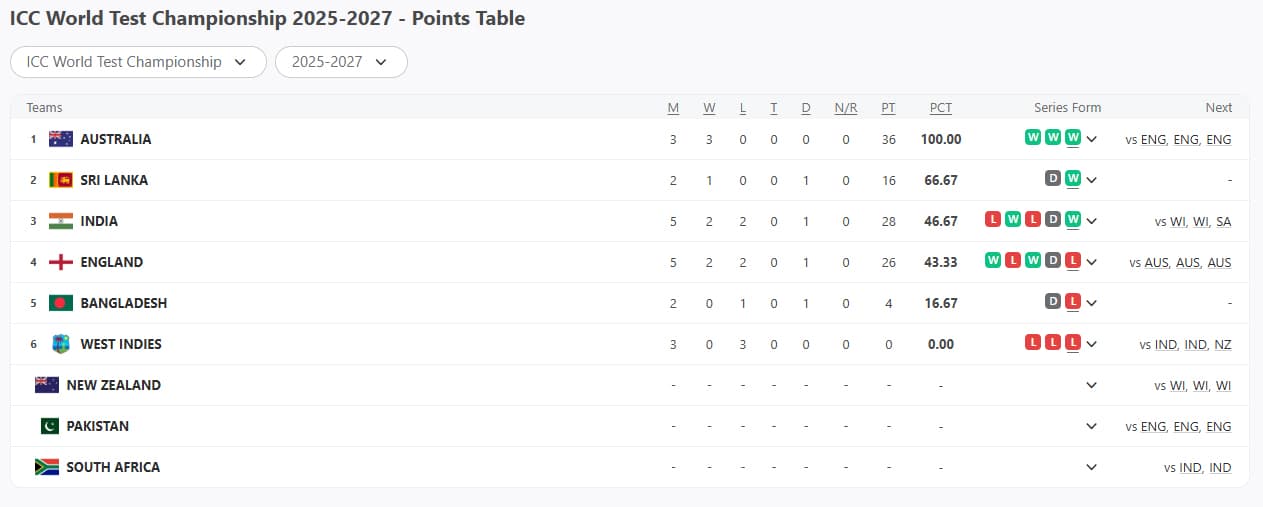
Here's a look at the current WTC points table, updated after the thrilling India vs. England Test series:
| Rank | Team | Matches | Won | Lost | Drawn | Points | PCT |
| 1 | Australia | 3 | 3 | 0 | 0 | 36 | 100.00% |
| 2 | Sri Lanka | 2 | 1 | 0 | 1 | 0 | 16 |
| 3 | India | 5 | 2 | 2 | 1 | 28 | 46.67% |
| 4 | England | 5 | 2 | 2 | 1 | 26 | 43.33% |
| 5 | Bangladesh | 2 | 0 | 1 | 1 | 4 | 16.67% |
| 6 | West Indies | 3 | 0 | 3 | 0 | 0 | 0.00% |
| 7 | New Zealand | 0 | 0 | 0 | 0 | 0 | 0.00% |
| 8 | Pakistan | 0 | 0 | 0 | 0 | 0 | 0.00% |
| 9 | South Africa | 0 | 0 | 0 | 0 | 0 | 0.00% |
Export to Sheets
Note: The table includes point deductions for slow over-rates. England, for example, has been docked two points.
Key Takeaways and Qualification Scenarios
- Australia leads the charge: With a perfect start to their campaign, winning all three of their matches against the West Indies, Australia is firmly at the top of the table with a flawless 100% PCT. They have set a high benchmark for the other teams.
- India and England in a tight battle: The recent Test series between India and England was a nail-biter, with India securing a historic win at The Oval to level the series. This victory propelled India to the third spot, just above England, who suffered a point deduction for a slow over-rate at Lord's. The competition between these two cricketing giants is far from over.
- Sri Lanka's strong start: Sri Lanka has quietly made a strong start to their WTC campaign, occupying the second spot after a win and a draw against Bangladesh. Their high PCT puts them in a great position early in the cycle.
- The sleeping giants: Teams like New Zealand, Pakistan, and defending champions South Africa are yet to play a match in this WTC cycle. Their entry into the tournament will undoubtedly shake up the standings and make the race to the final even more exciting.
The road to the WTC final in 2027 is long and filled with twists and turns. As more matches are played, the table will continue to change, and the qualification scenarios will become clearer. Teams will need to maintain consistency, win crucial series, and avoid penalties to secure one of the top two spots. The next few months promise to be a thrilling time for Test cricket fans around the world.


Responses (0 )